d-Omix: A
Mixer of Generic Protein Domain Analysis Tools
Data
Data tab
allows a user to upload raw
InterProScan resulted files as input for protein domain analysis tools
including Tree, Graph, Alignment, and Interaction.
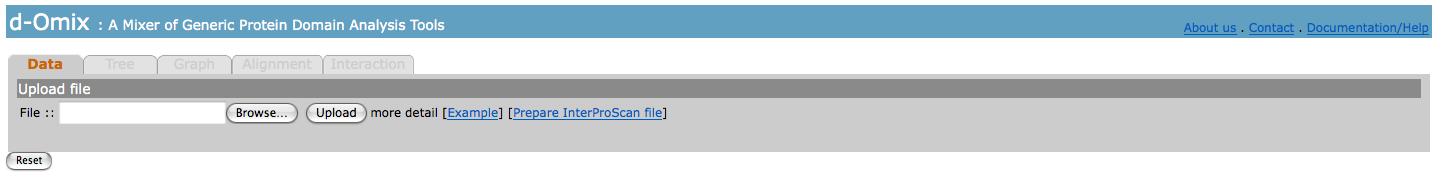
The click
on [Example] will perform an automatic loading of exampled data sets.
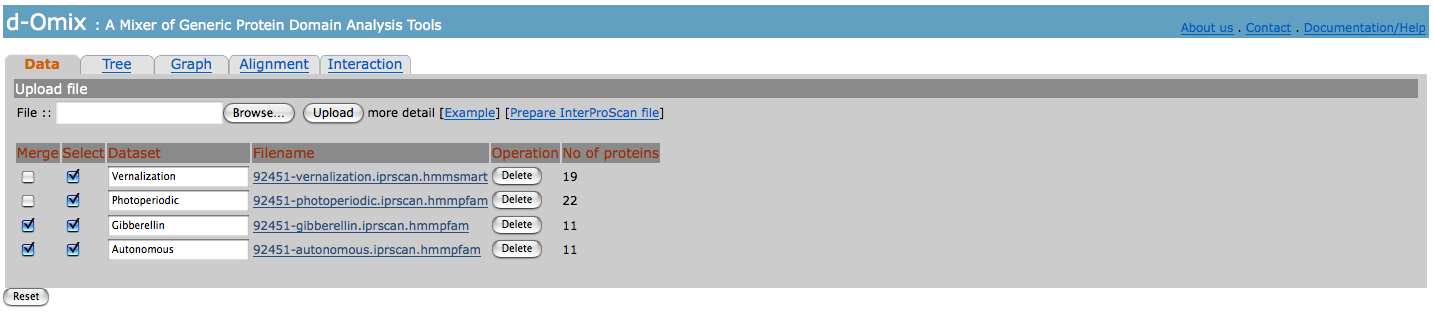
With at least
one uploaded data set, tabs for domain analysis tools will be activated. For
each uploaded data set, the user needs to specify a name for it. The
user may
merge data sets together for the comparative analyzes. In this example, we
merged Gibberellin and Autonomous data sets together.
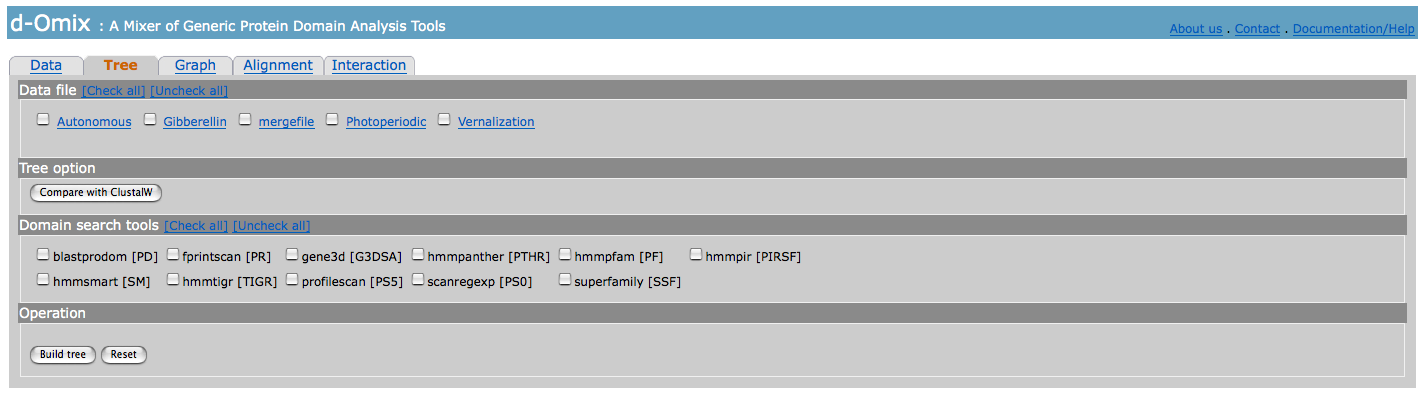
When Tree tab selected, the
following page will be shown. Data file, Domain search tools, and Operation sections will be the same for all analysis
tools.
-
Data
file section will contain all data files selected and/or merged from the Data
tab. These data files could be updated by going back to customize
the data files in Data tab. Note that the
current results will be discarded with the new selected and/or merged data
sets.
-
Domain
search tools section lists all domain search tools that the user could select
for the analysis. Note that some of the selected search tools
might not produce results, as there is no
input data for those search tools.
-
Operation
section simply contains button to start the analysis. The reset button allow
the user to redo
the analysis with changed data files and/or
domain search tools and/or specialized
parameters as in case of Tree and Alignment.
Tree option section is specialized for Tree analysis. It allows the user to
compare domain architecture (DA)-based trees with CLUSTALW-based trees.
The
following figure shows the results after Tree building.
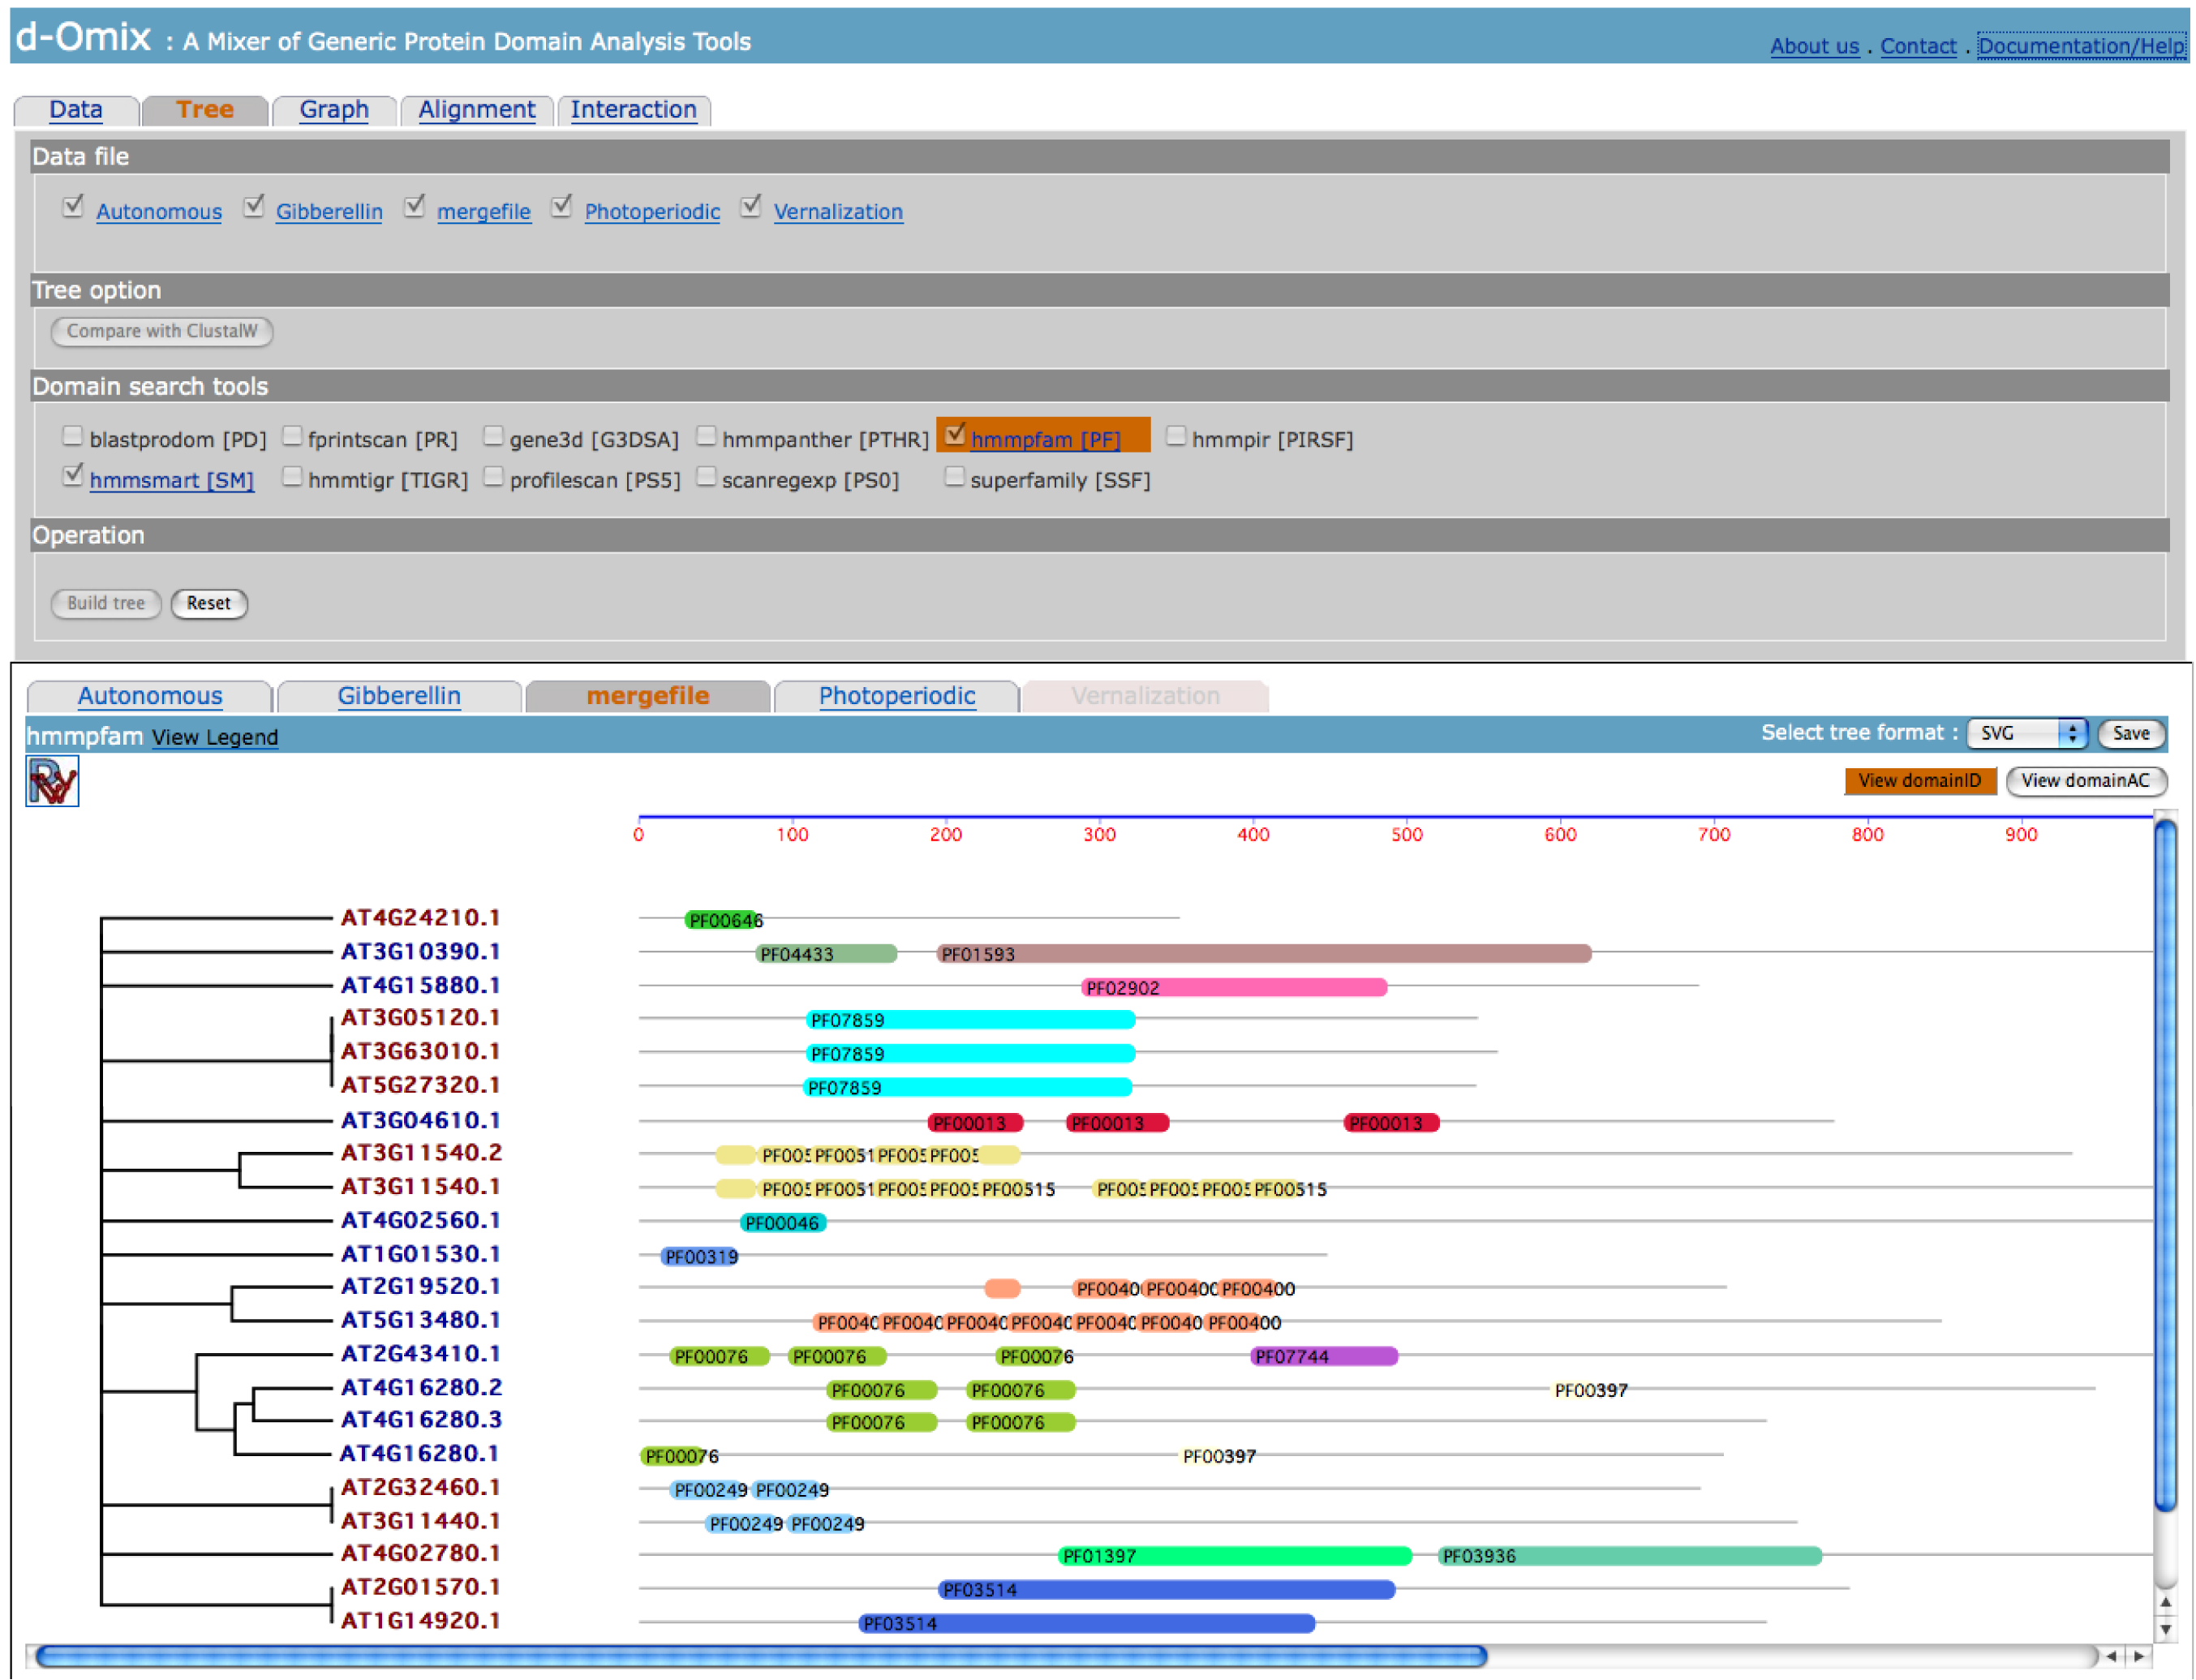
Tabs in
result section correspond to selected files in Data file section. In this
example shows DA-based tree built from the merged data file between Gibberellin
and Autonomous data sets. The click on “View domainAC” button will redraw the DAs of proteins using domain
accession numbers (AC) instead of domain identifiers (ID) as shown in the
following figure.
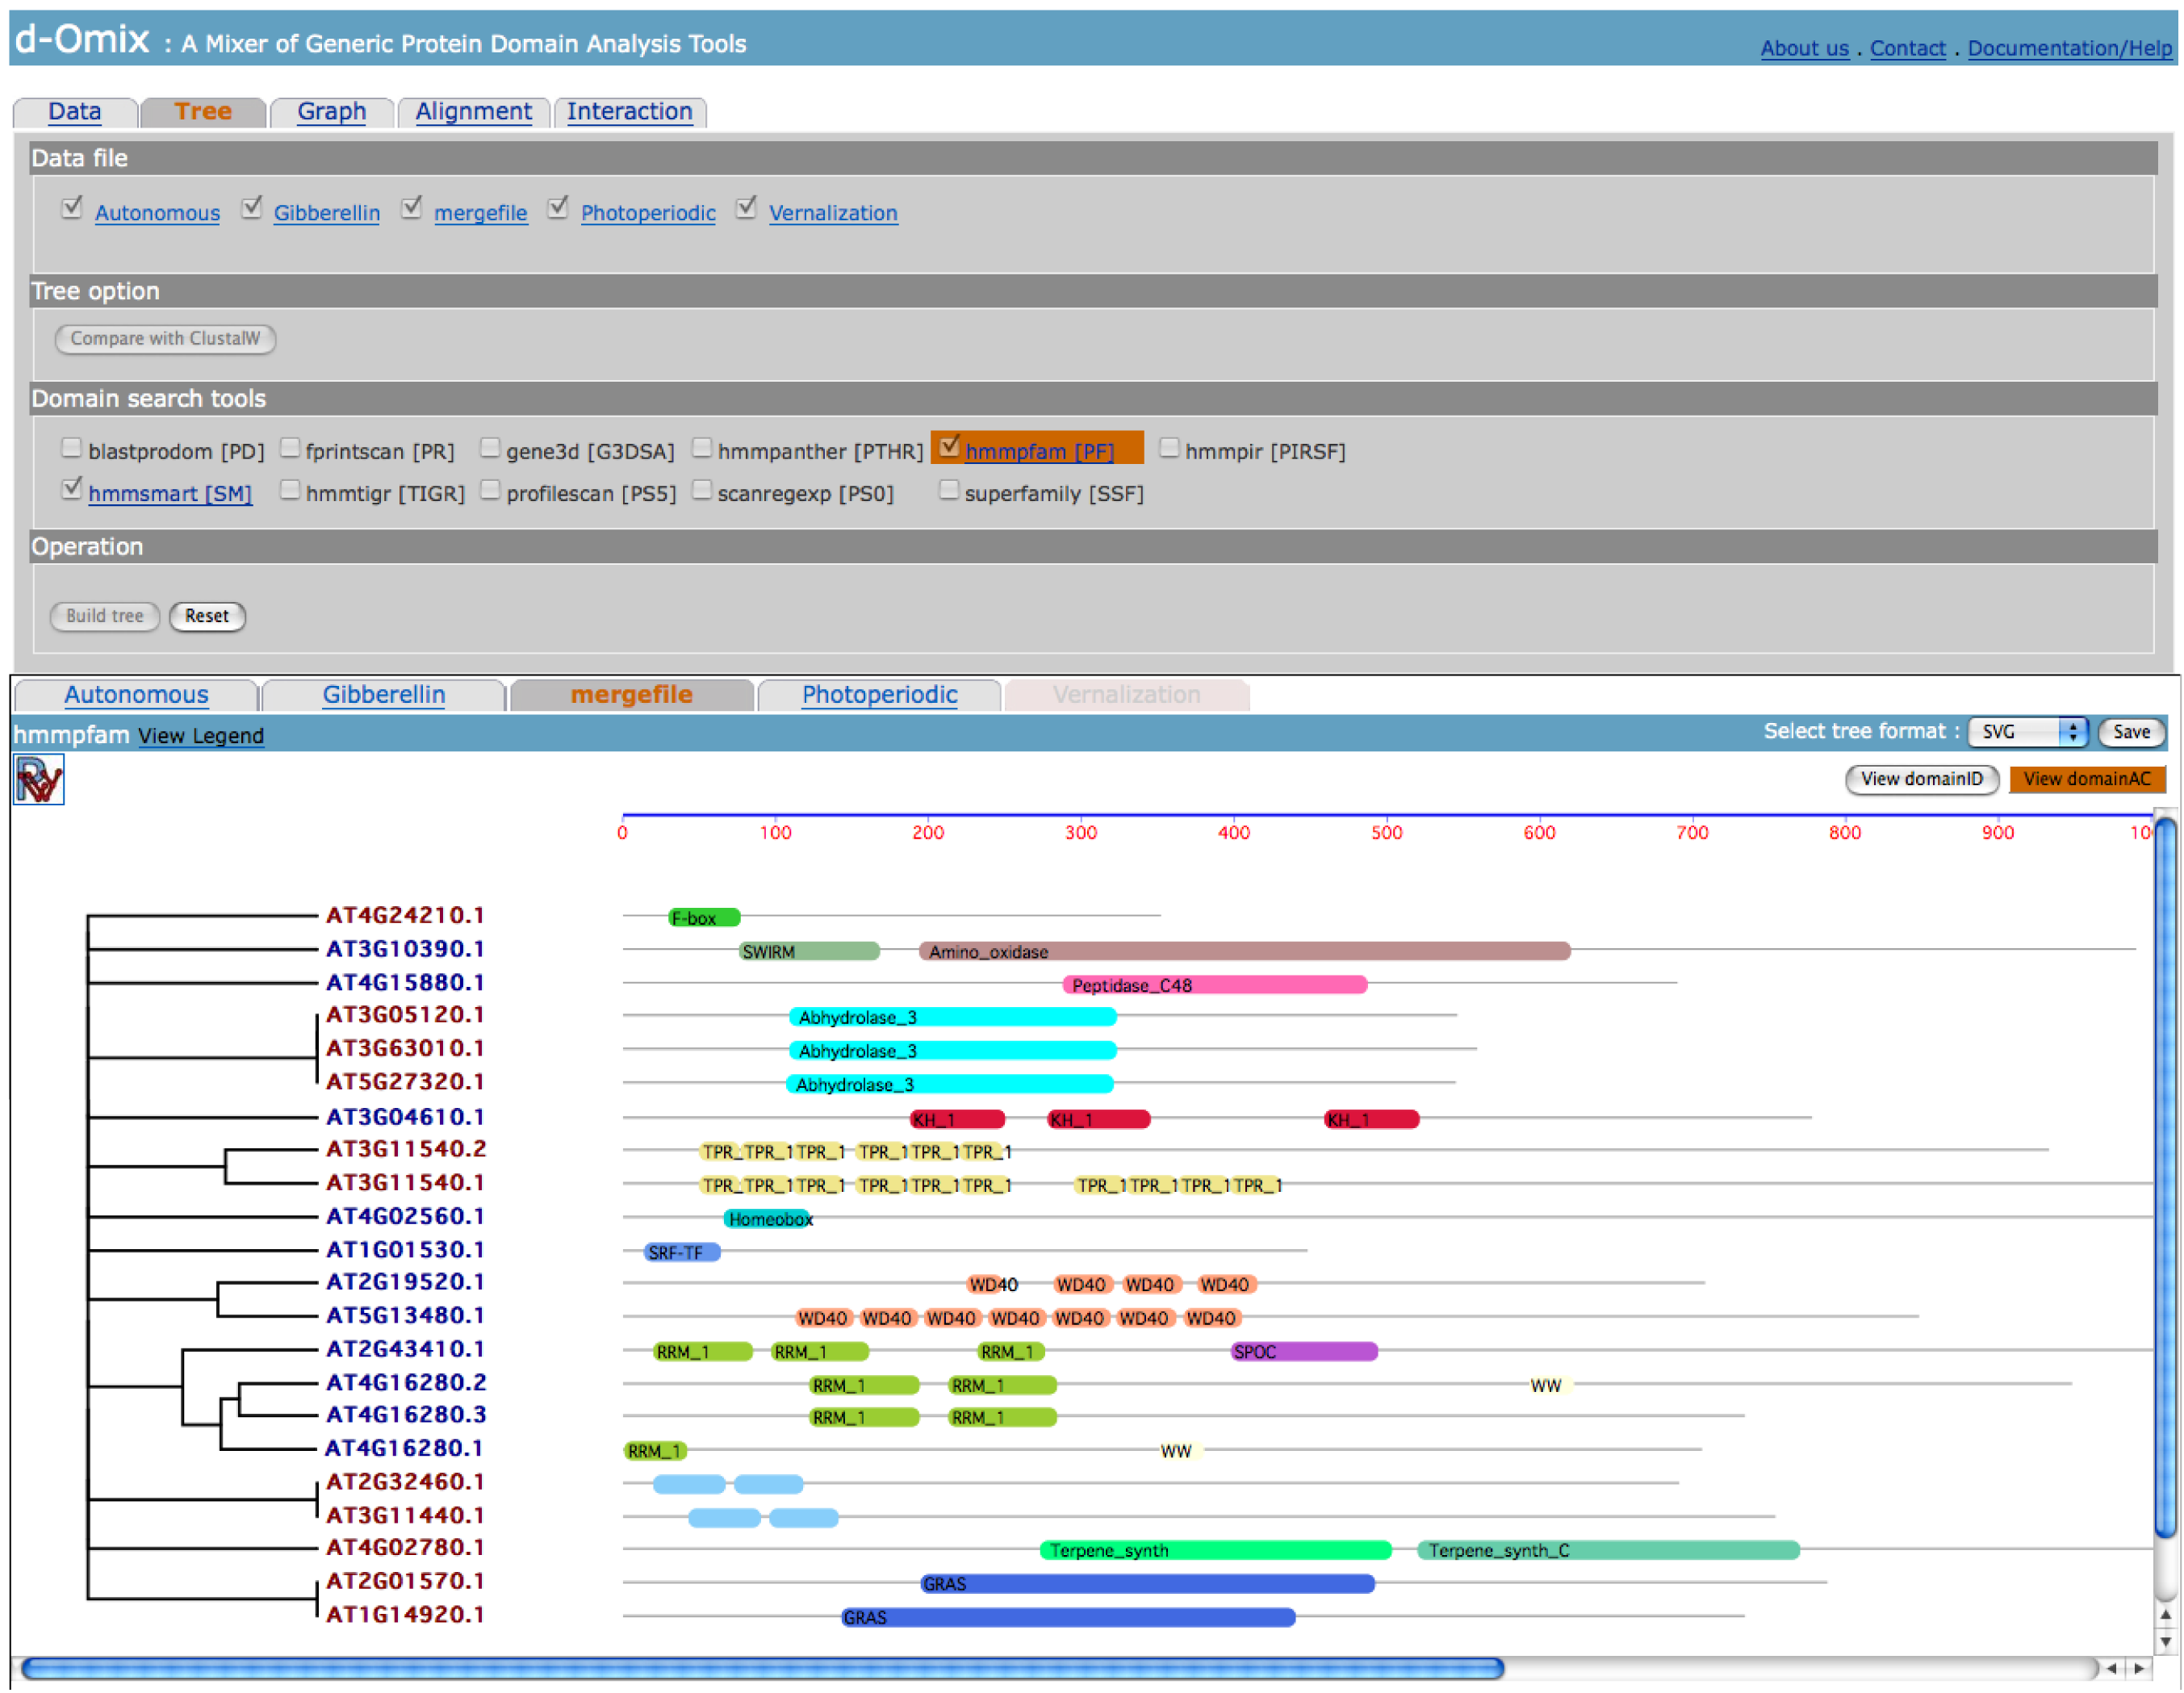
The click
on ![]() icon will send the current tree to
PhyloWidget [1] for further viewing and editing the resulted tree.
icon will send the current tree to
PhyloWidget [1] for further viewing and editing the resulted tree.
Domain
graph mainly computes the versatility and abundance [2] of protein domains. When
Graph tab selected, the same three sections: Data file, Domain search tools,
and Operation will be shown. After selecting some data files and domain search
tools, the click on “Build graph” button will generate domain graphs. The
following figure shows domain graph with direction built from the merged data
file between Gibberellin and Autonomous data sets.
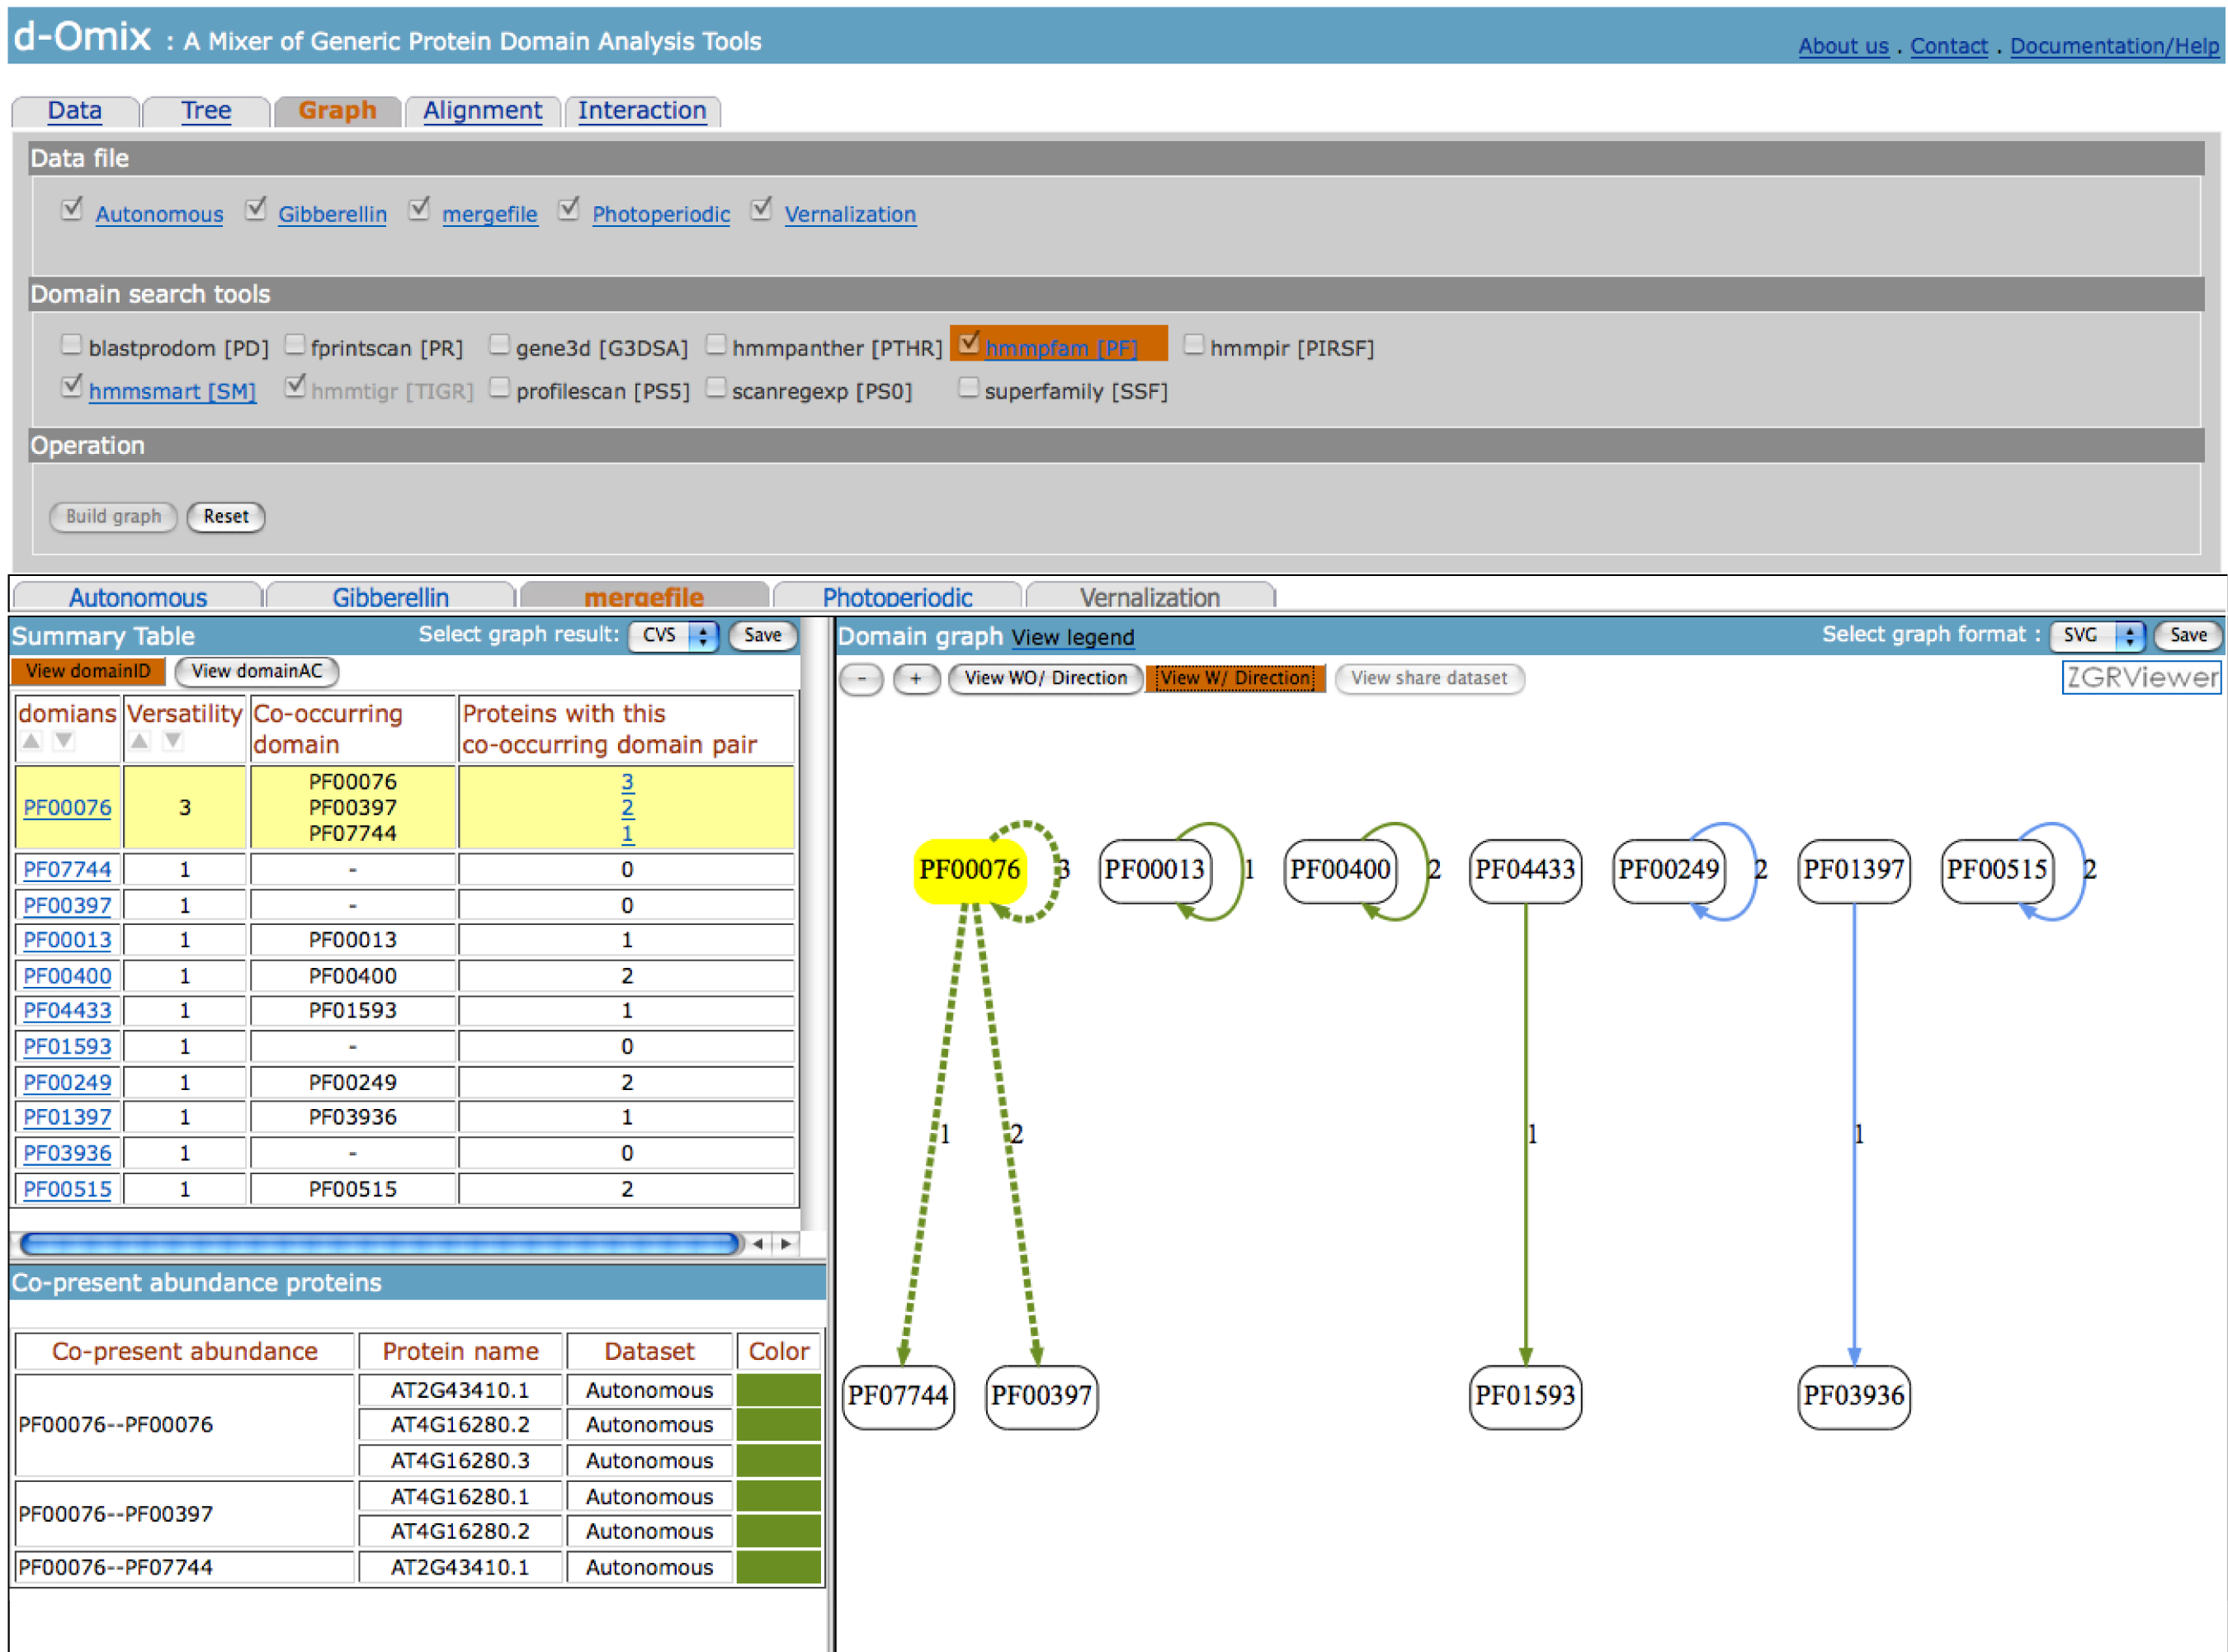
The click on “View domainAC” button on
the left will redraw domain graphs using domain accession numbers (AC) instead
of domain identifiers (ID) as shown in the following figure.
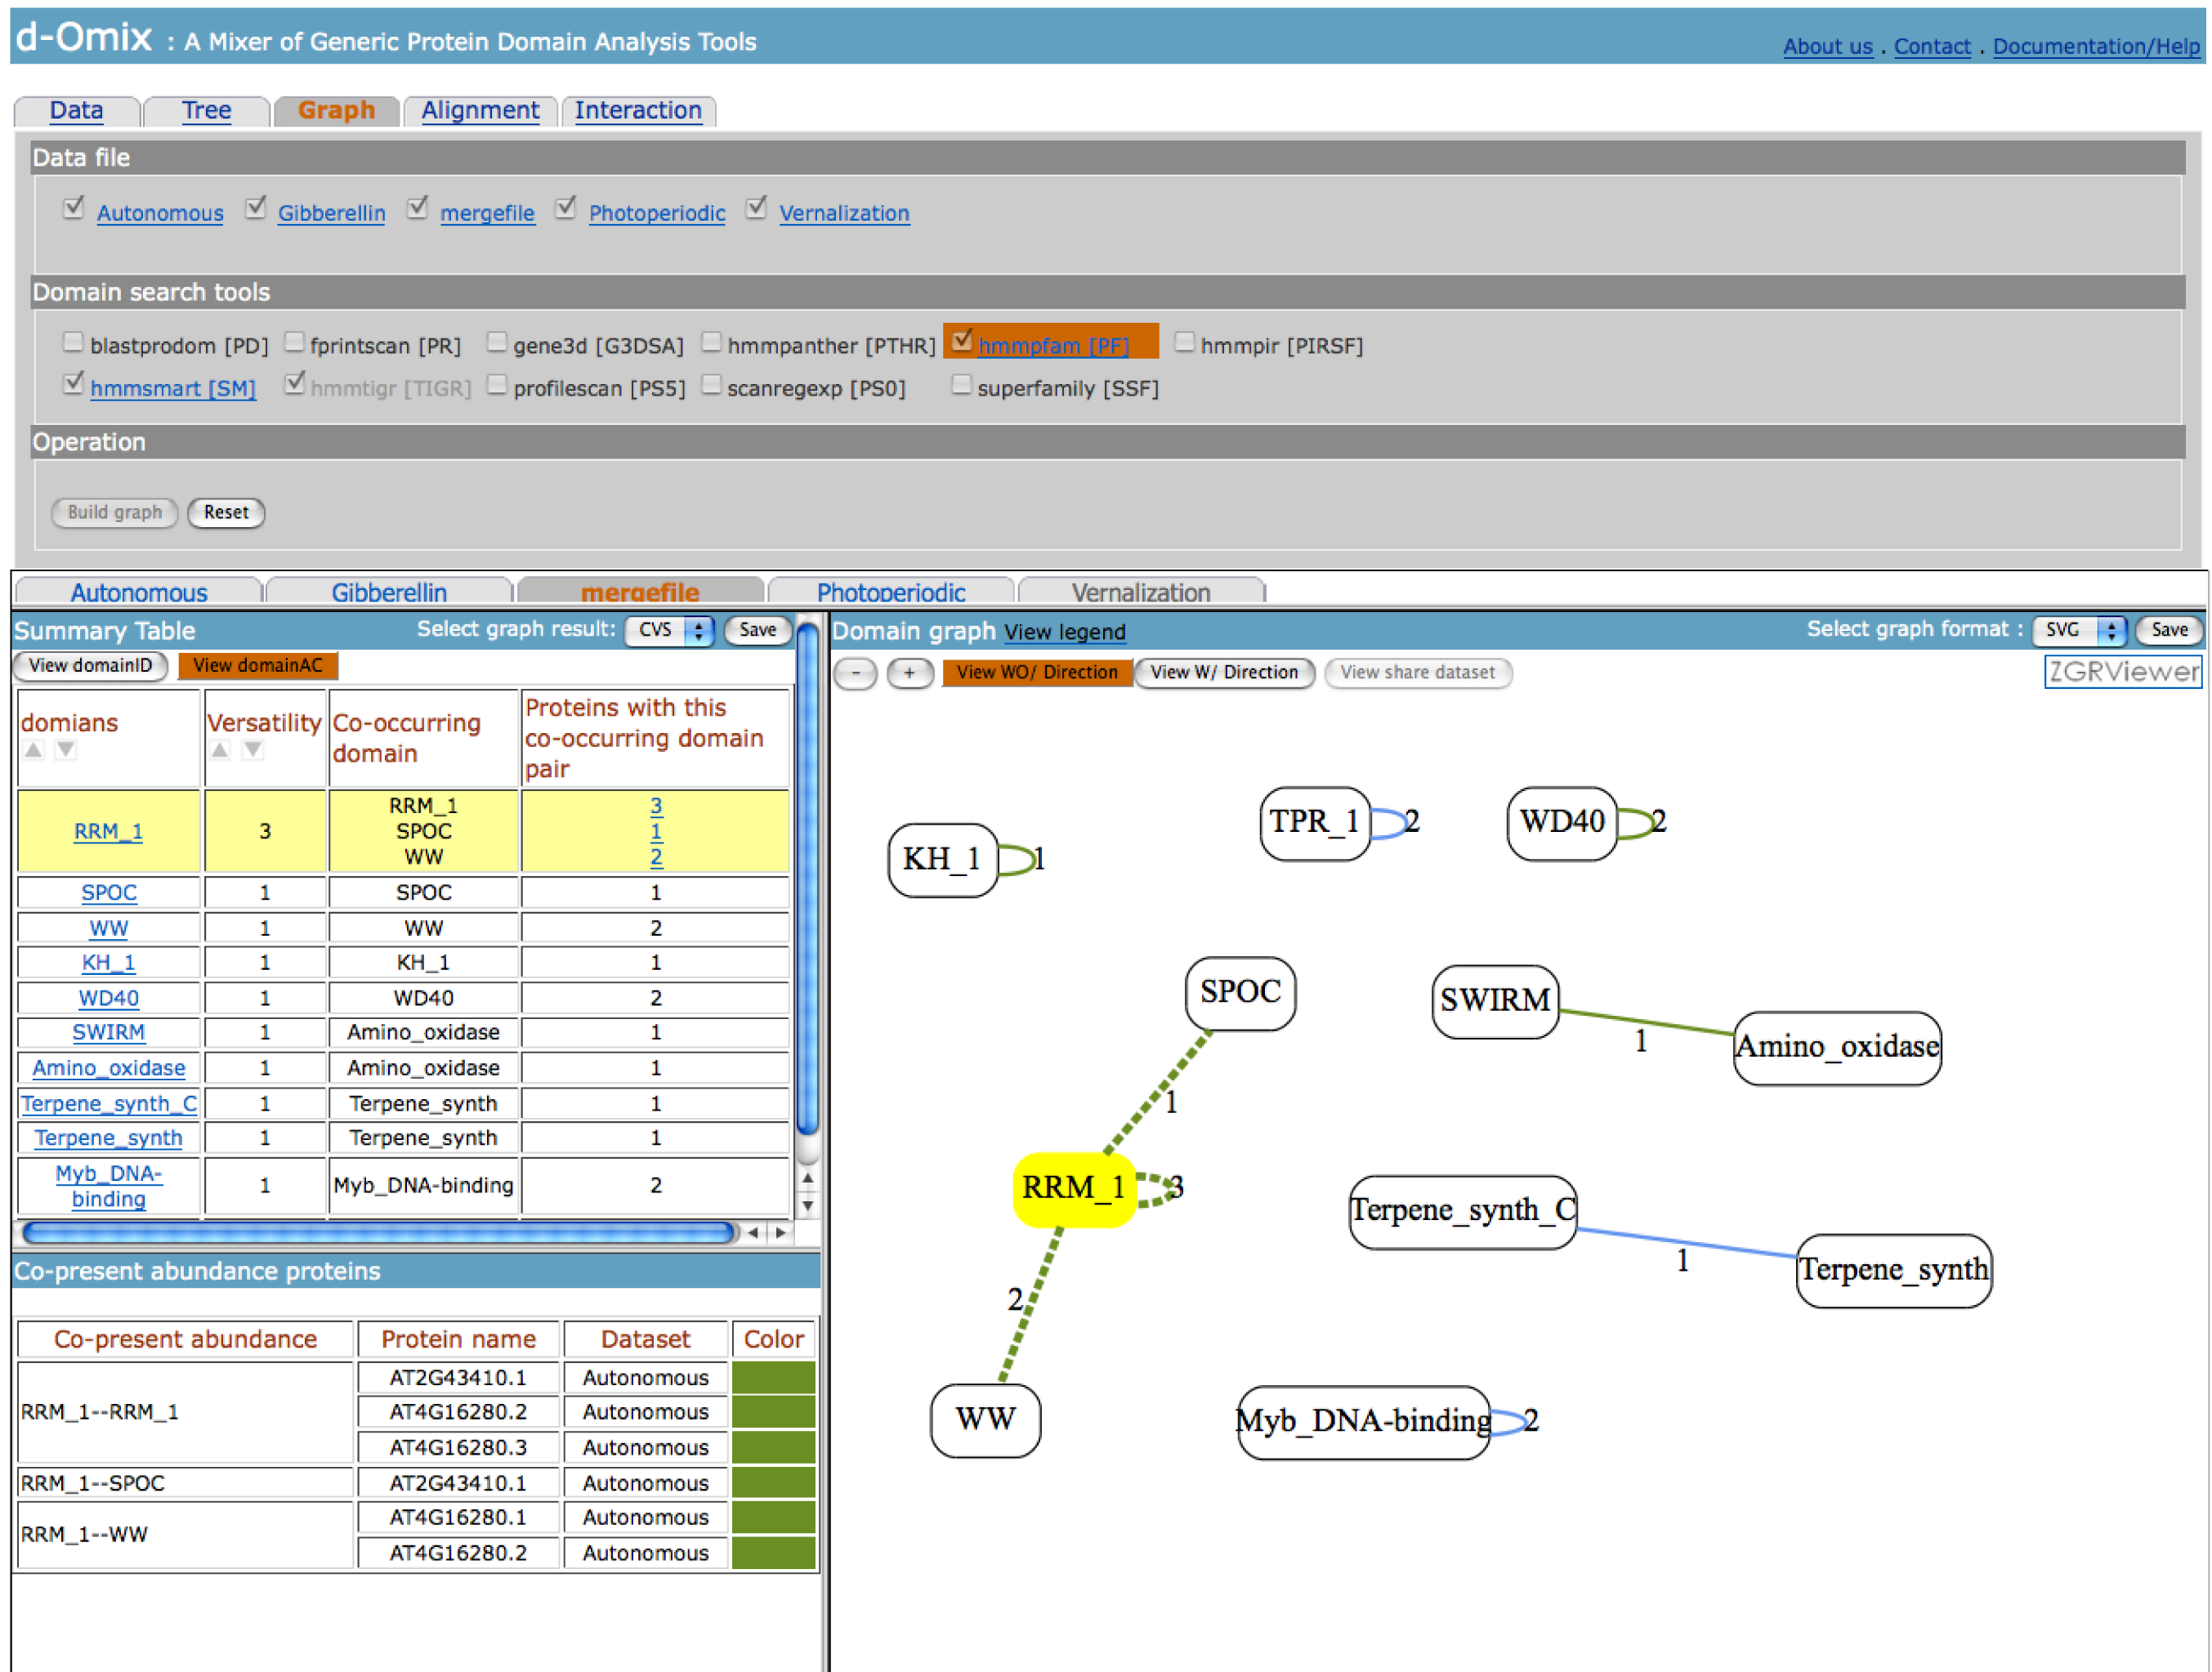
If the
domain graph is large, the user may click on ![]() icon to send the current graph to
ZGRViewer [3] for easy navigation and smooth zoomable features.
icon to send the current graph to
ZGRViewer [3] for easy navigation and smooth zoomable features.
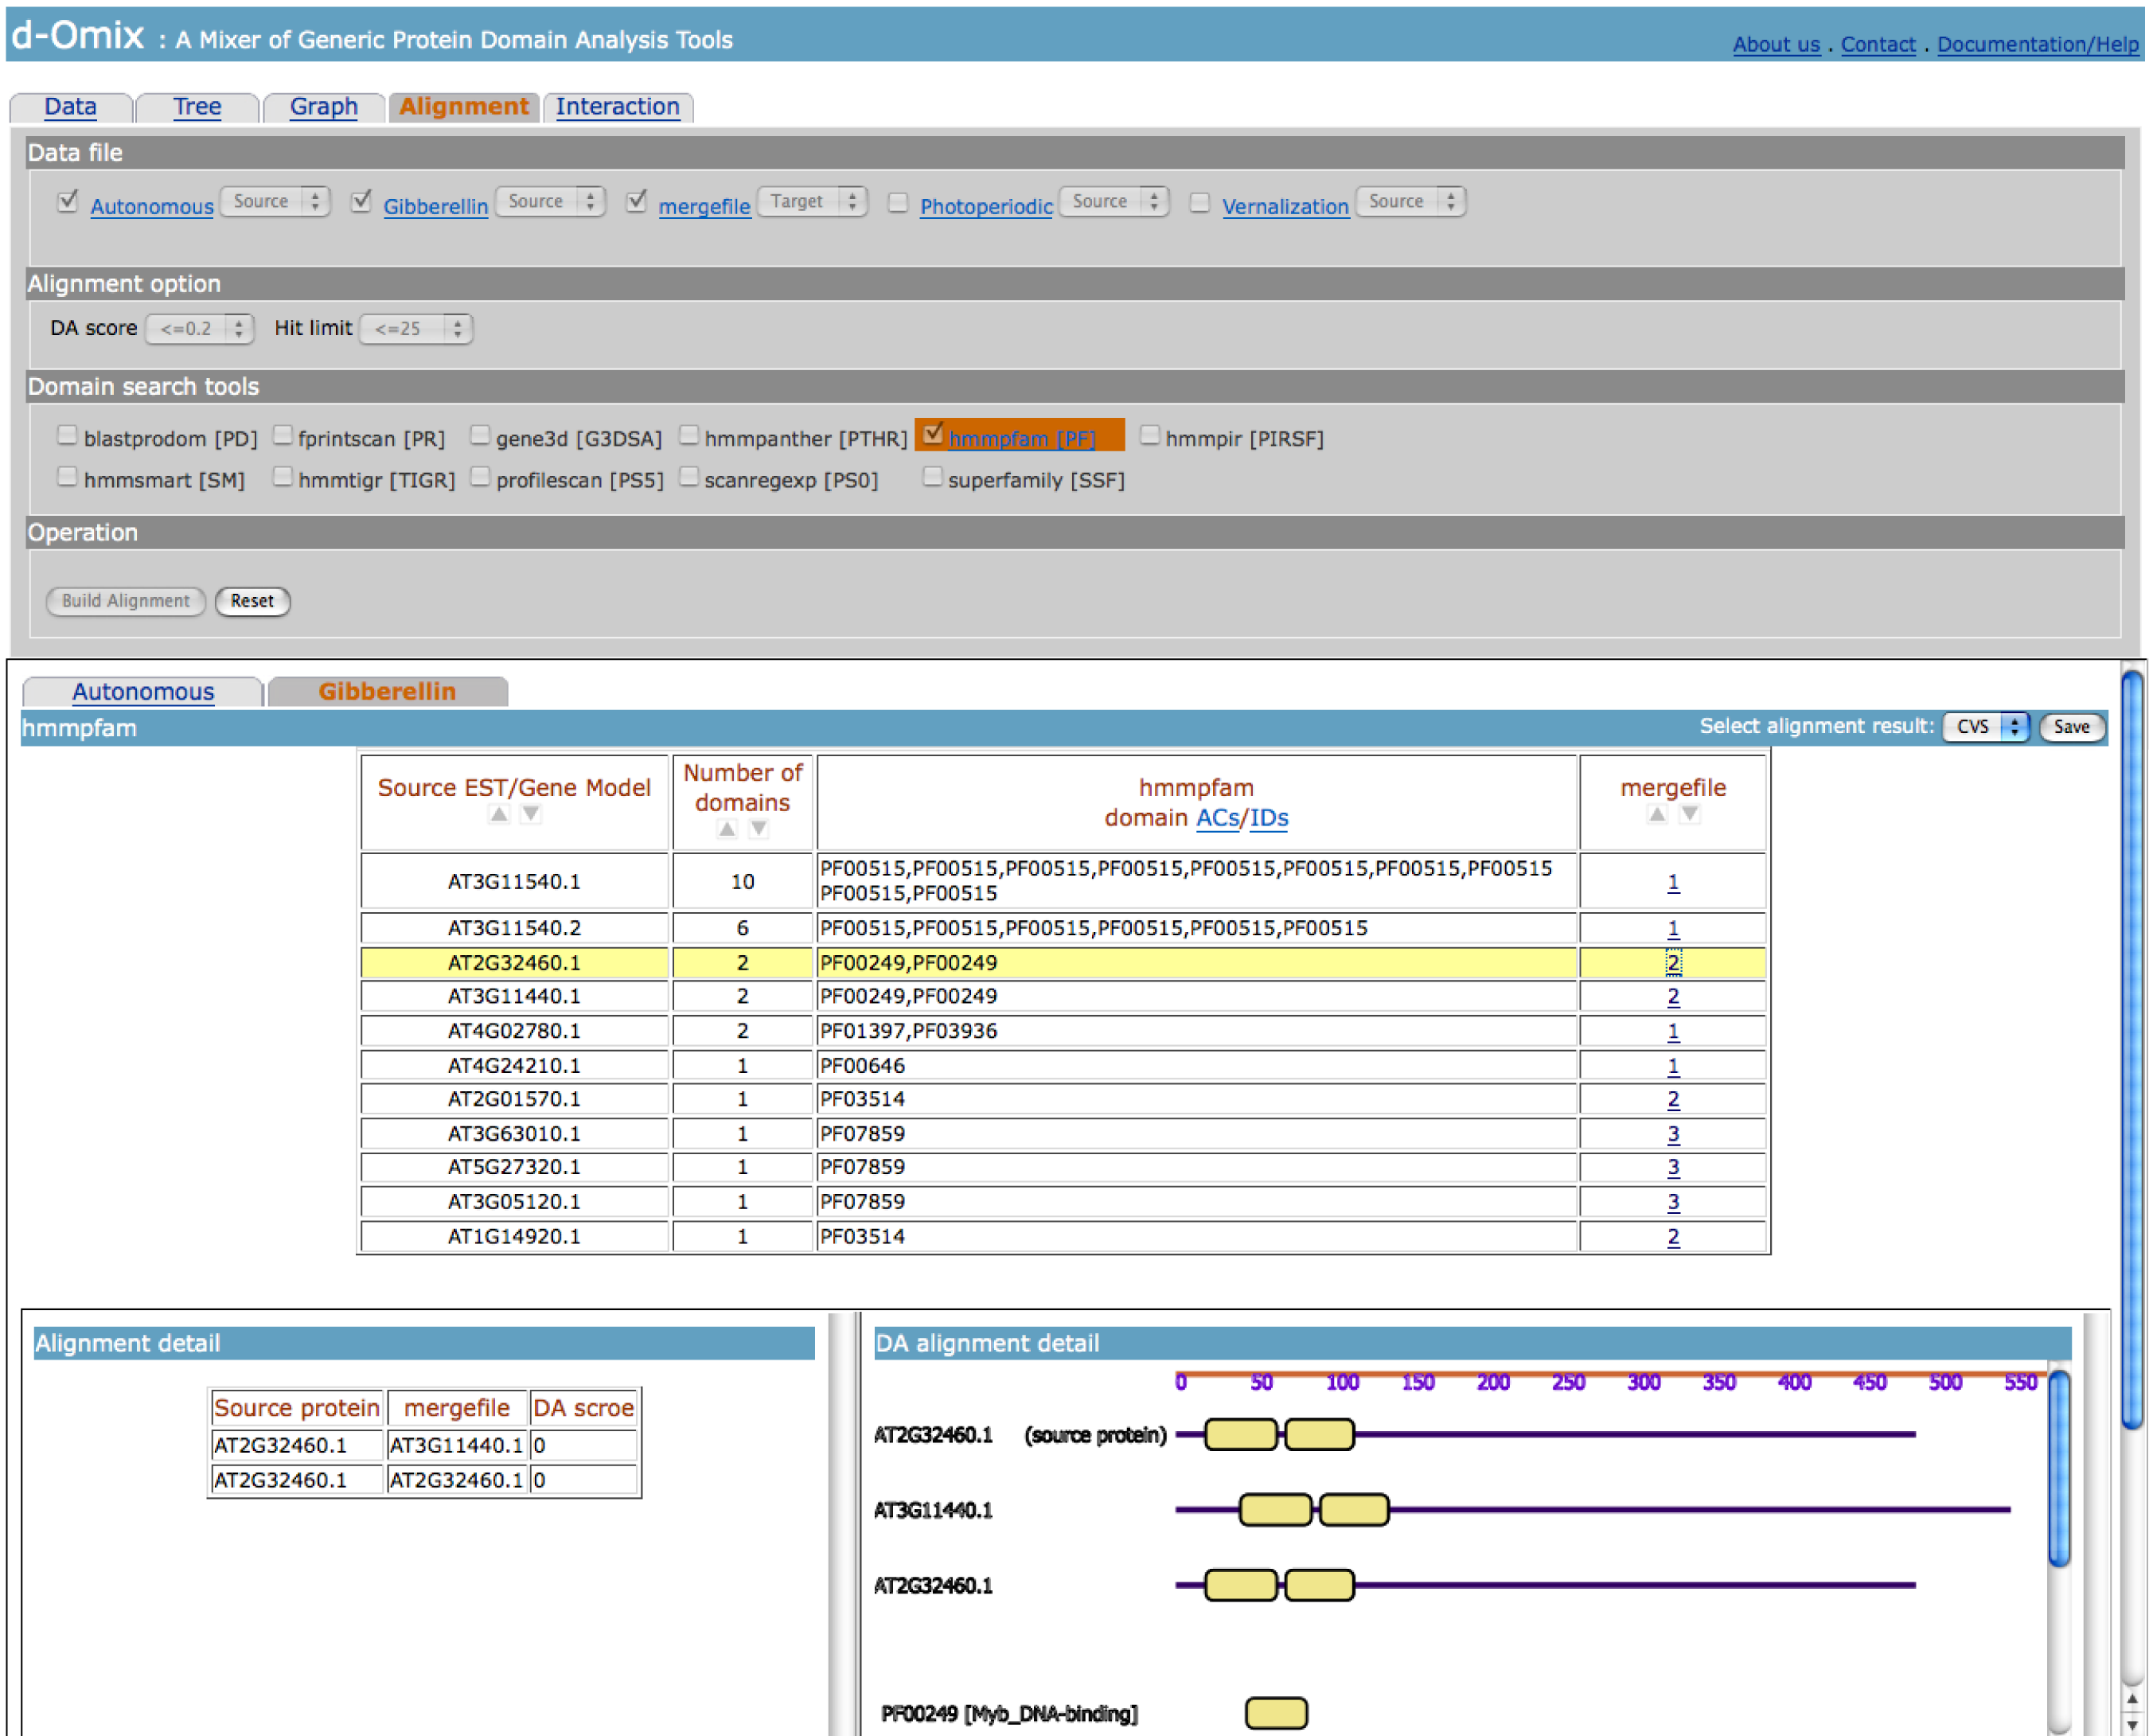
The Alignment tool allows the user
to compare the similarities between proteins based on the similarities of their
protein domain architectures (DAs). In this page, besides the same three Data
file, Domain search tools, and Operation sections, the user also needs to
specify if a selected data set is a source or target which is respectively
analogous to the queried sequences and searched against database in BLAST. Two
additional specialized parameters: DA score and Hit limit enable the user to
limit the number of similar proteins in the alignment result. The lower DA
score the more similar DAs. Two proteins have exactly the same DAs if DA score
between them is zero. The
following figure shows an example of Alignment result.
Interaction tool builds a
tentative protein network directly derived from domain-domain interactions from
DOMINE [4]. After selecting some
data files and domain search tools, the click on “Build tentative protein
network” button will generate the results as shown in the following figure. The
shown tentative protein network is built from the merged data file between
Gibberellin and Autonomous data sets. An edge between two proteins represents
the availability of known domain-domain interactions forming the DAs of the two
proteins.
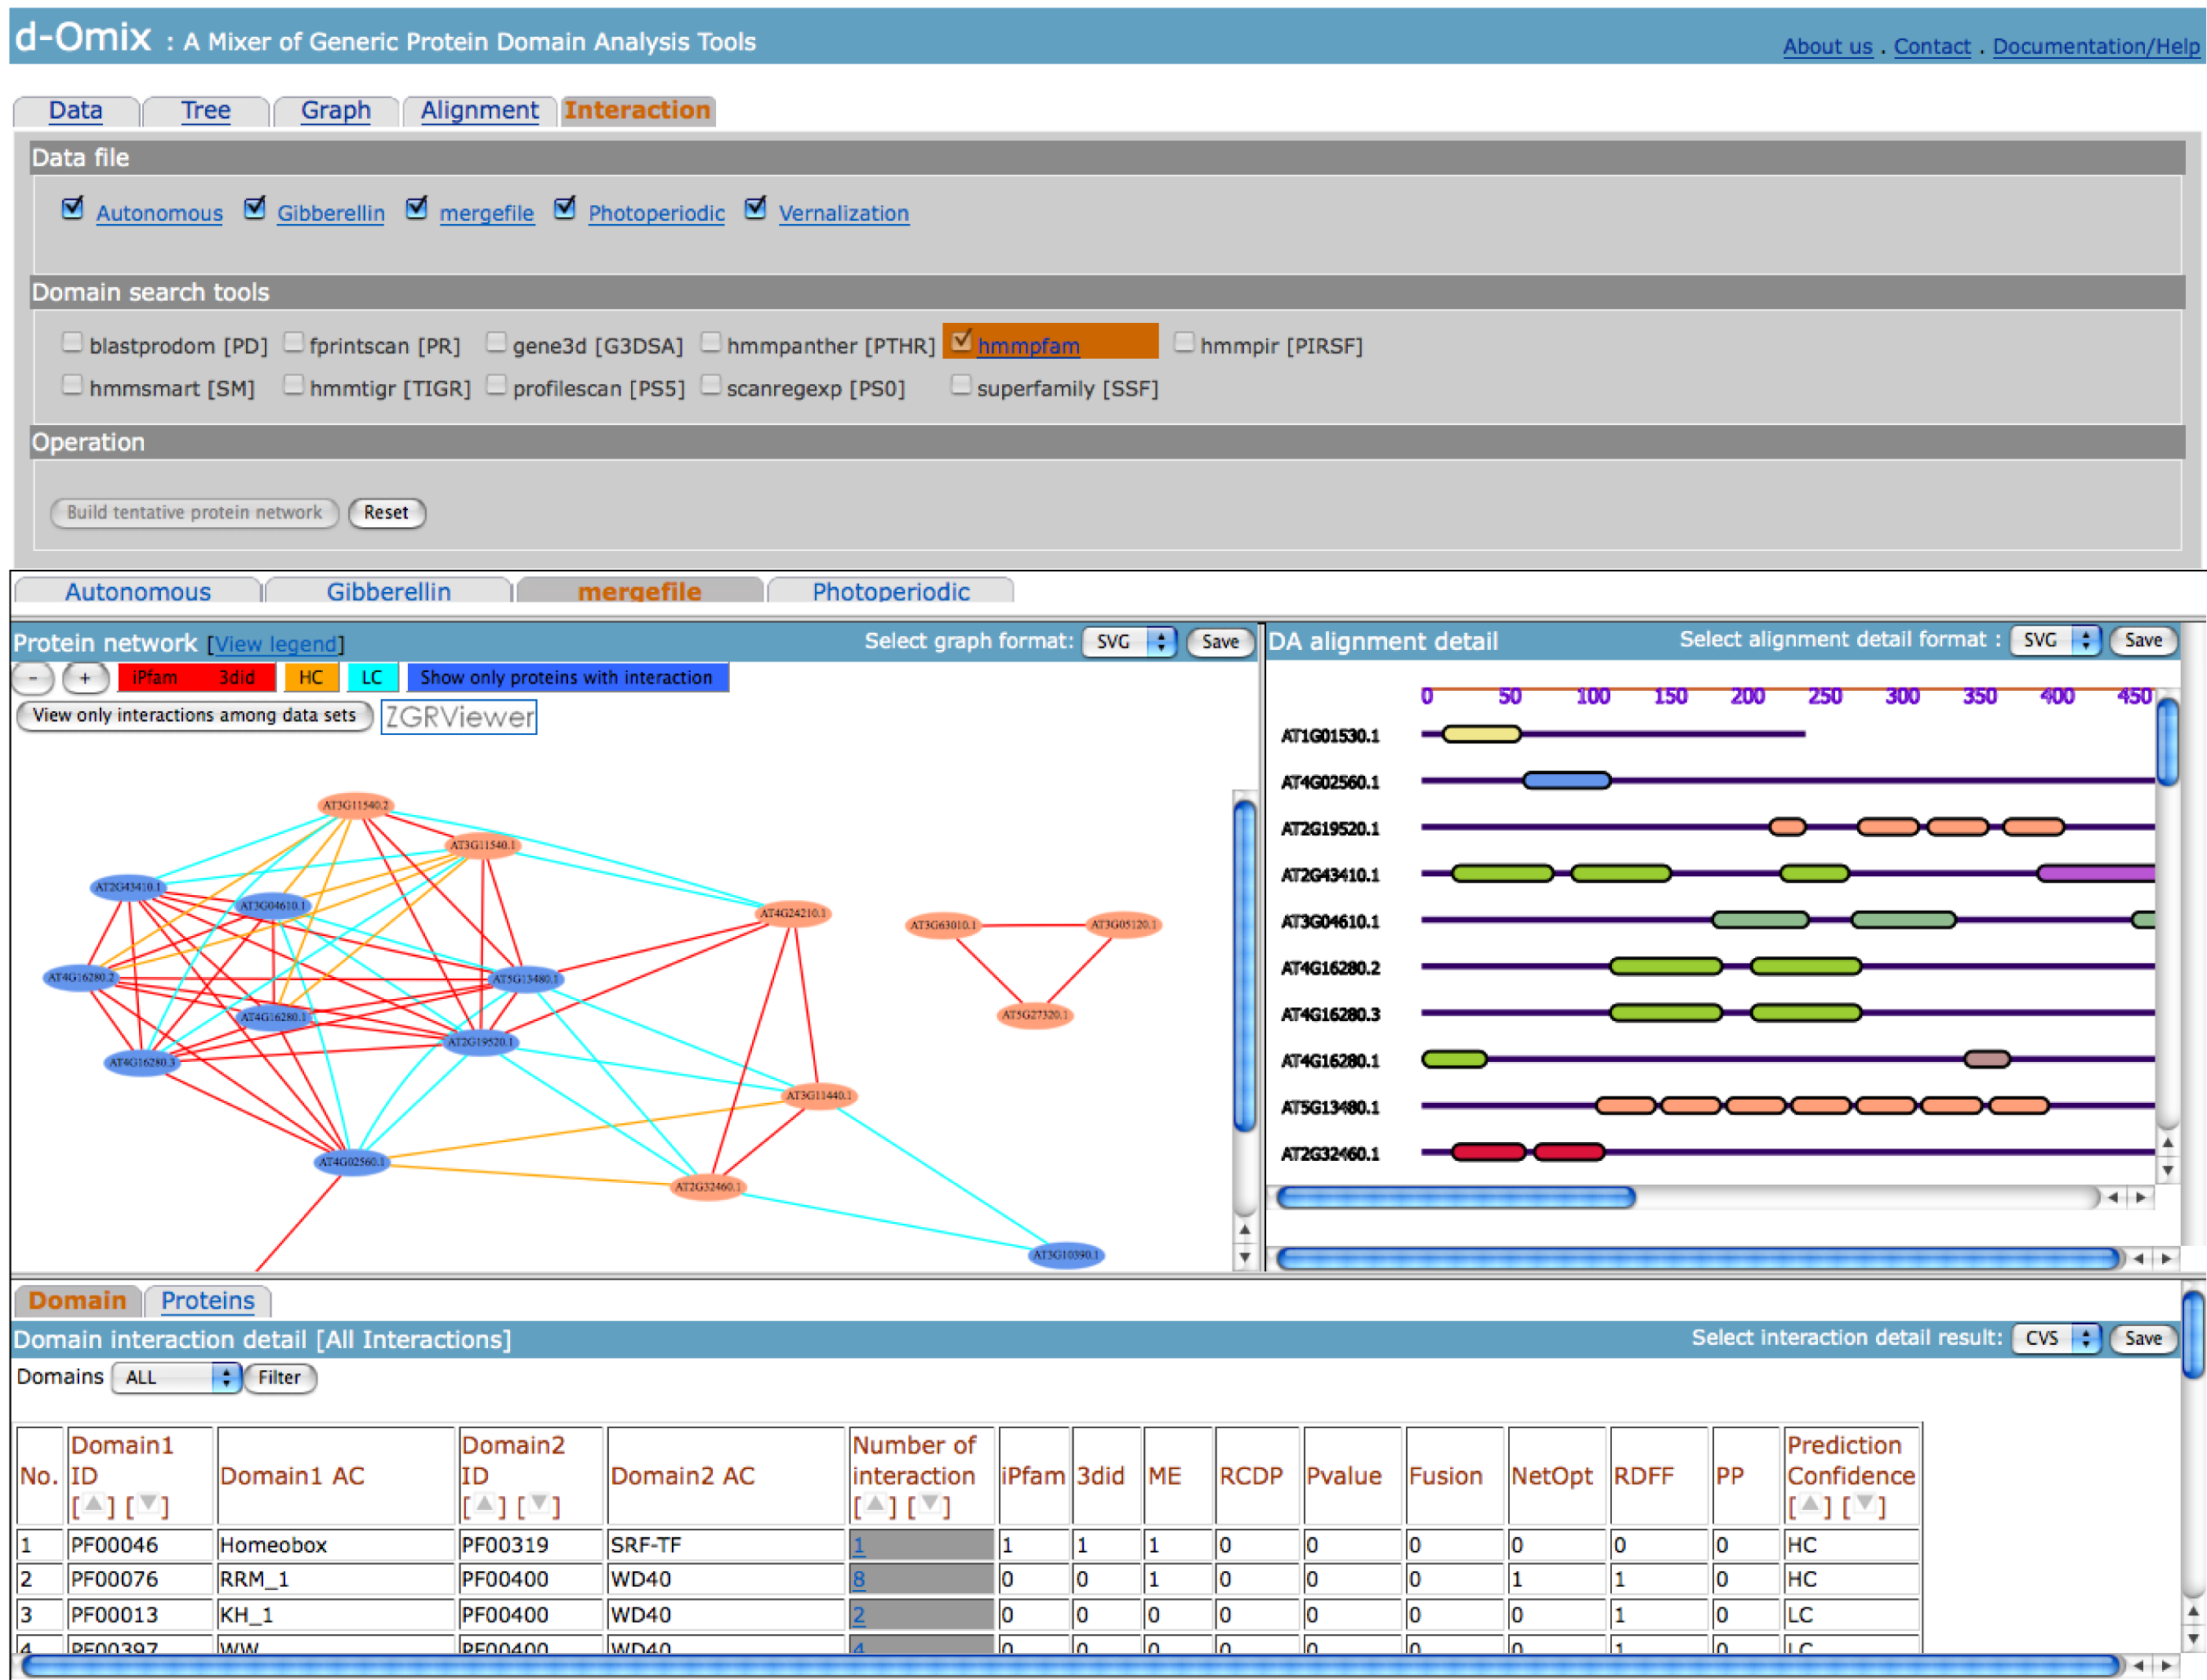
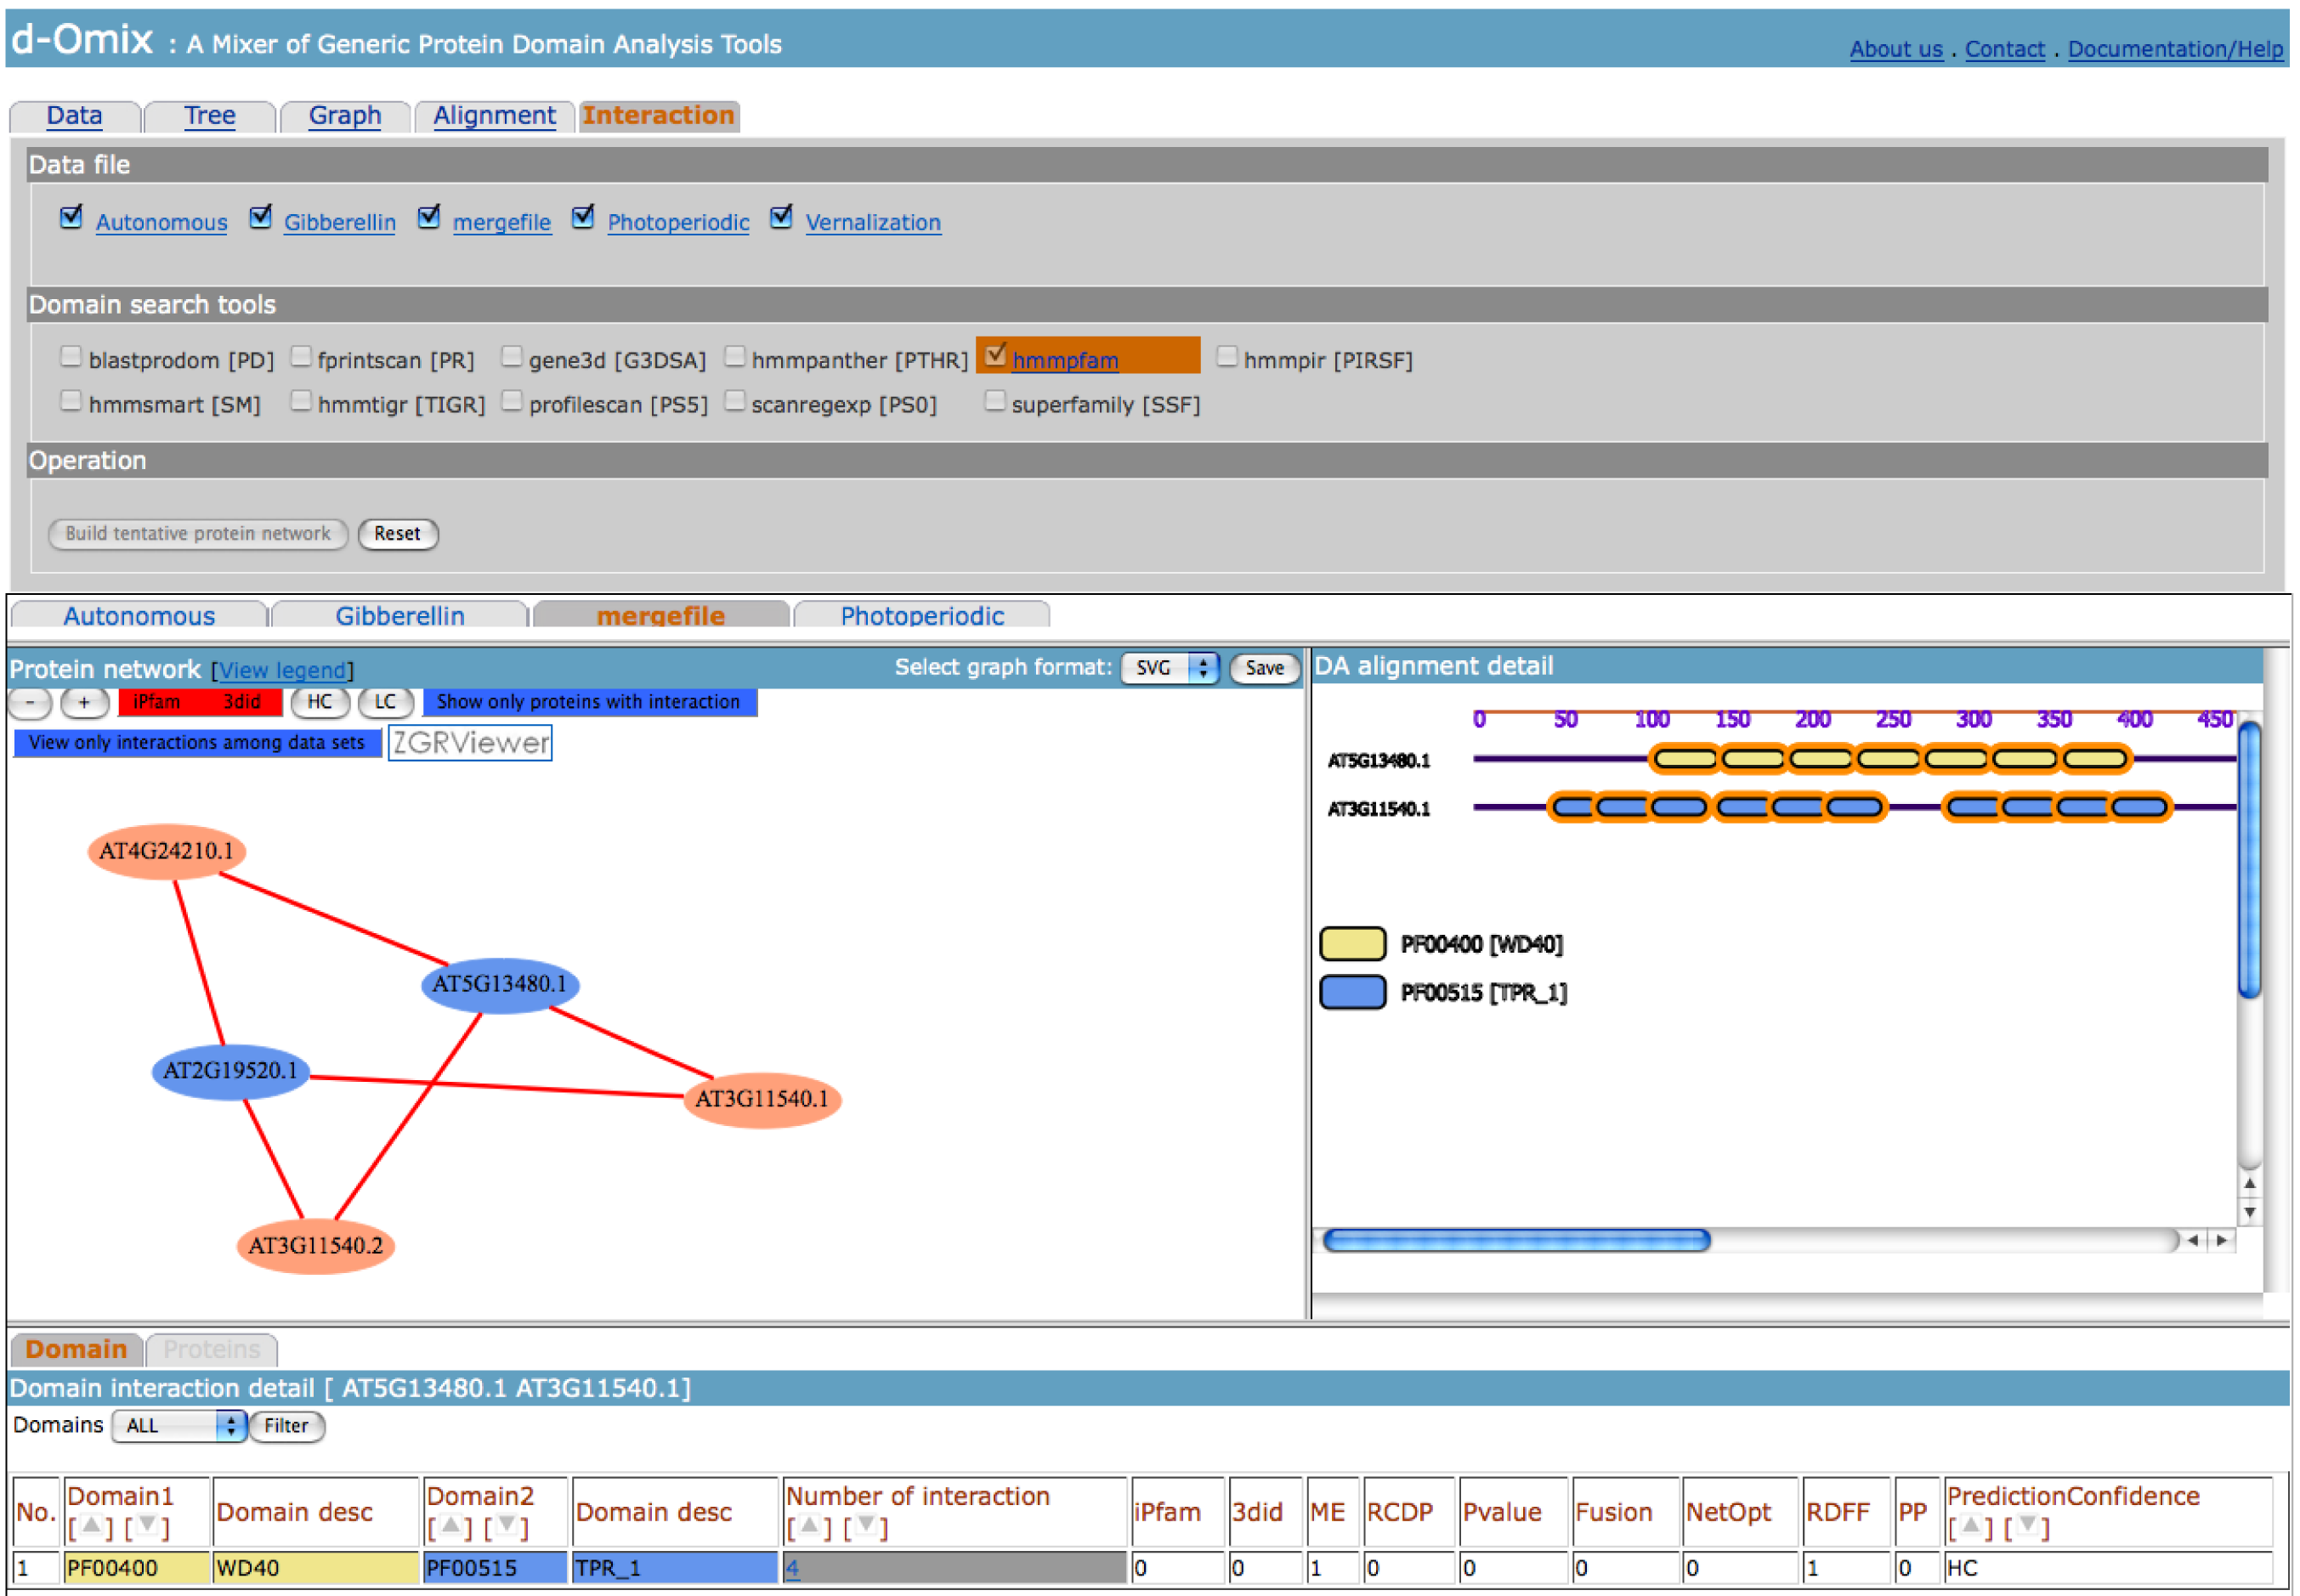
The user may filter the protein
network according to the confidence levels: iPfam ME 3did, HC, and LC of
domain-domain interactions from DOMINE. The click on an edge between two
protein nodes will refresh the DA alignment detail on the right with the DAs of
these proteins and a click on a protein domain with domain-domain interaction
information will highlight the domain and its interacting partners as shown in
below figure. Similar to domain graph, if the tentative protein network is
large, the user may click on ![]() icon to send the current network to
ZGRViewer[3] for easy navigation and smooth zoomable features.
icon to send the current network to
ZGRViewer[3] for easy navigation and smooth zoomable features.
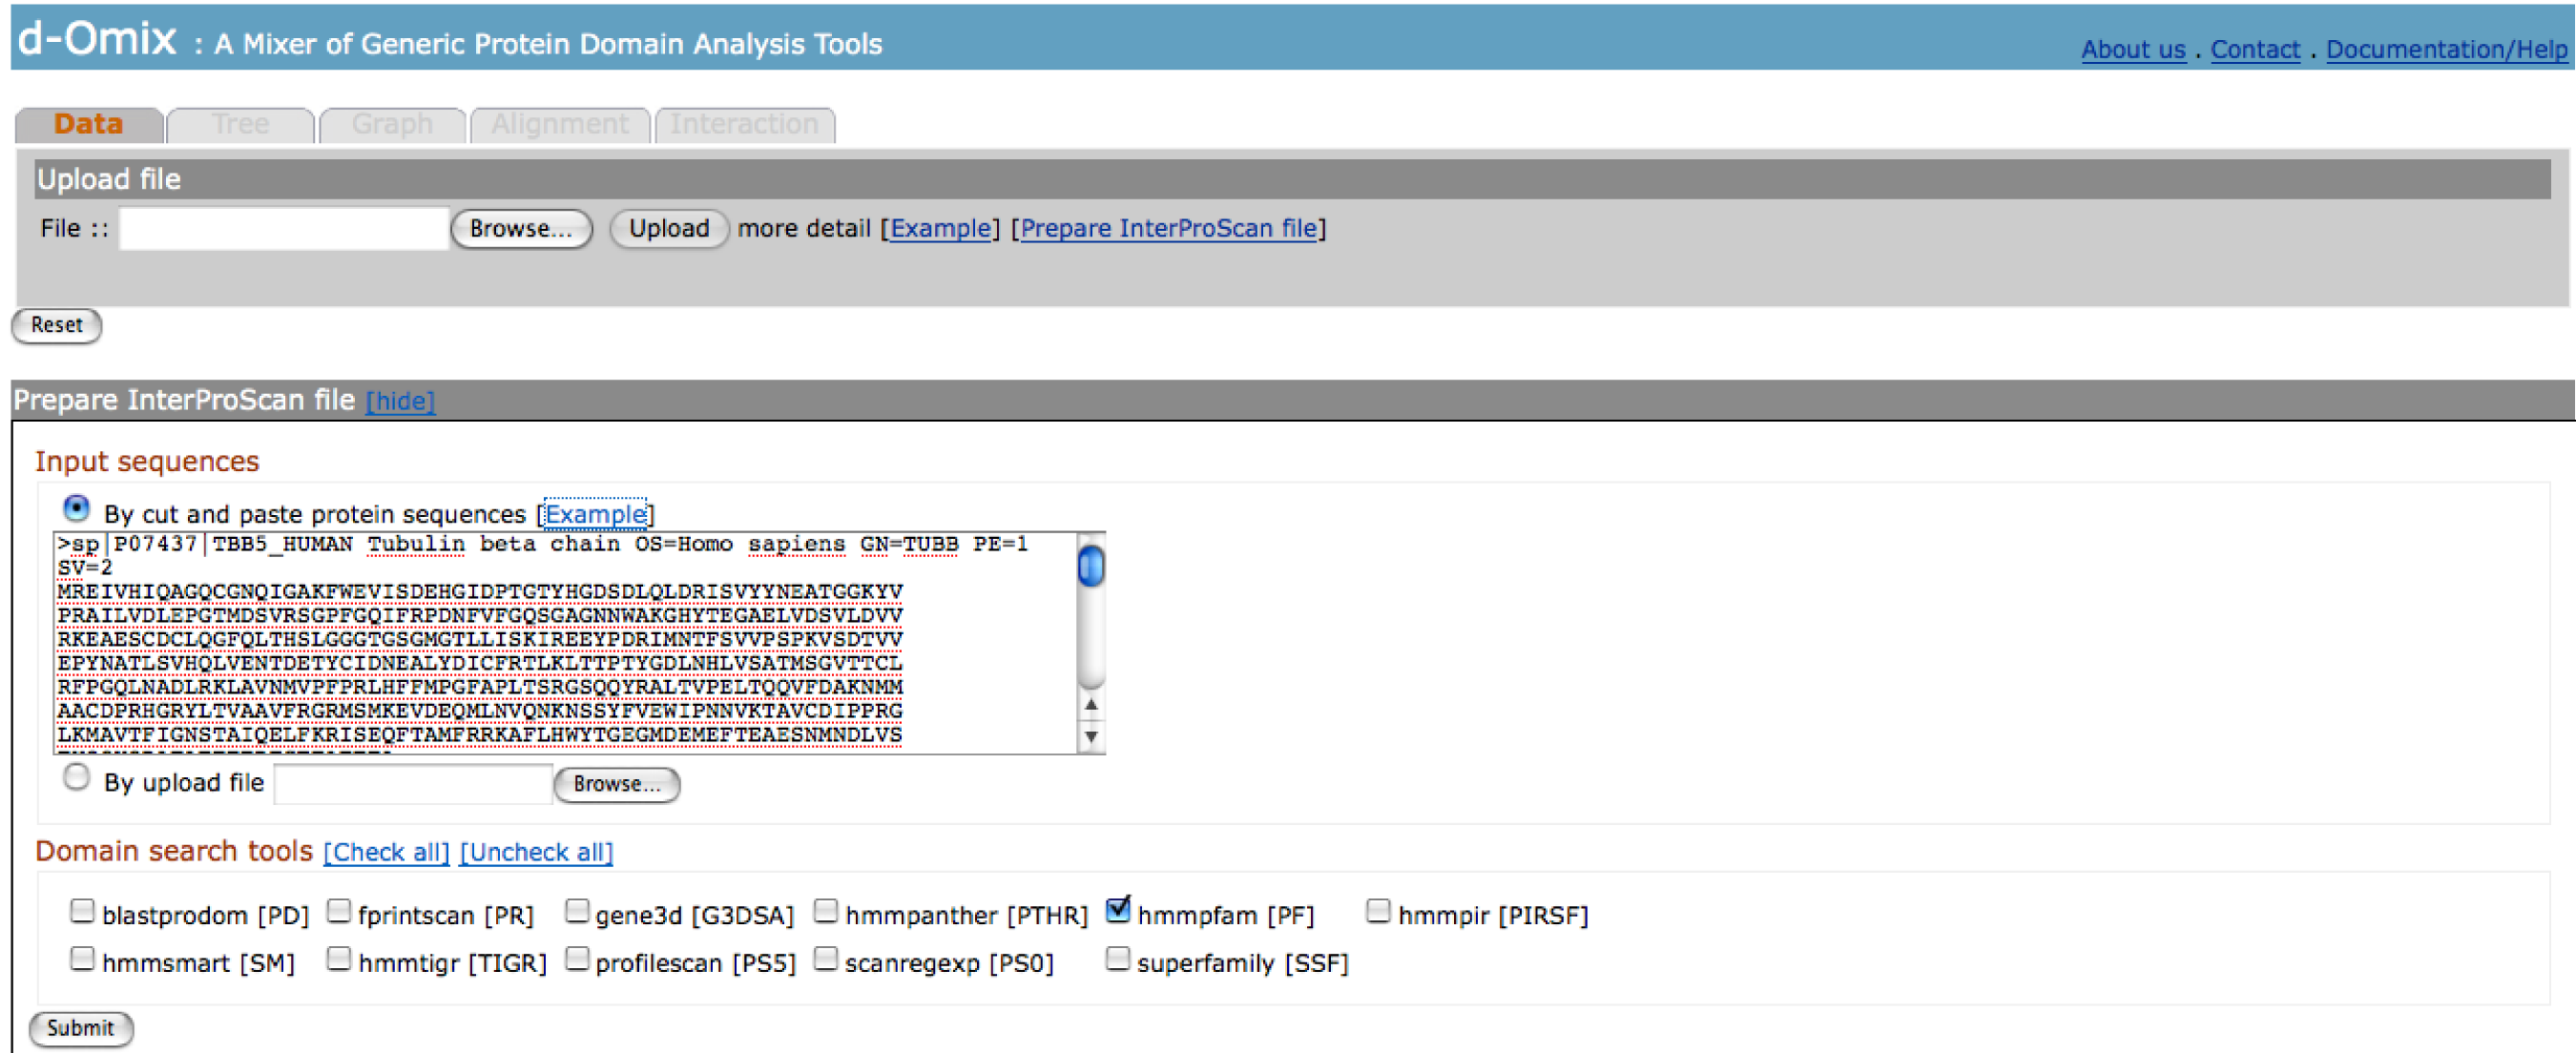
Prepare
InterProScan file
A user with only protein sequences
could still utilize d-Omix web server with an additional step for raw InterProScan
preparation. This option is located in Data tab. The click on [Prepare
InterProScan file] will show the following page. The user may cut and paste or upload their protein
sequences. In this figure, protein sequences in FASTA format comes from the
click on [Example] in this section. The user may select specific domain
search tools for InterProScan [5] running.
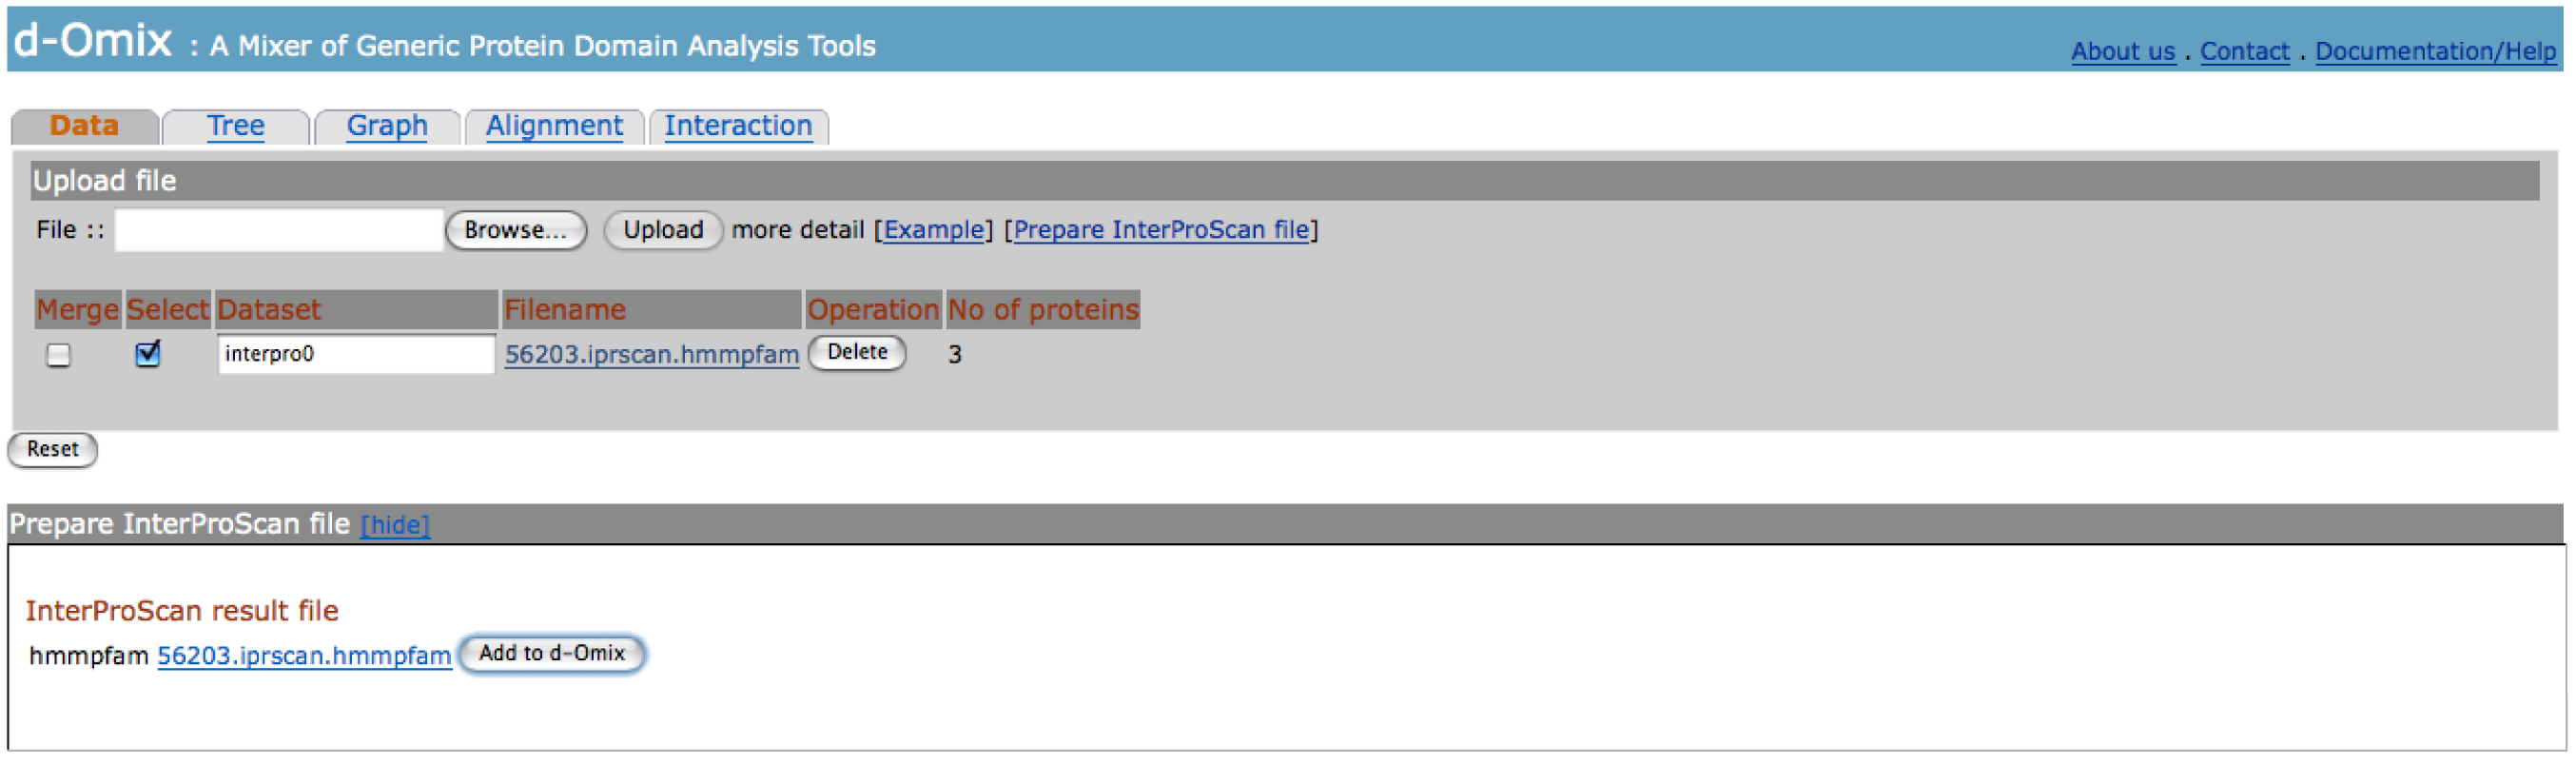
The
figure below shows the result page of InterProScan file preparation. The click on “Add to d-Omix” button
will automatically load the resulted file as an input file for d-Omix with a
default but customizable name.
REFERENCES:
1. Jordan GE, Piel WH (2008)
PhyloWidget: web-based visualizations for the tree of life. Bioinformatics:
btn235.
2. Vogel C, Teichmann SA, Pereira-Leal J (2005)
The Relationship Between Domain Duplication and Recombination. Journal of
Molecular Biology 346: 355.
3. Pietriga E (2005) A Toolkit for
Addressing HCI Issues in Visual Language Environments. IEEE Symposium on Visual
Languages and Human-Centric Computing (VL/HCC) 00: 145-152.
4. Raghavachari B, Tasneem A, Przytycka TM,
Jothi R (2008) DOMINE: a database of protein domain interactions. pp. D656-661.
5. Quevillon E, Silventoinen V, Pillai S,
Harte N, Mulder N, et al. (2005) InterProScan: protein domains identifier. Nucl
Acids Res %R 101093/nar/gki442 33: W116-120.